Hoe houdt u een grafiek altijd in beeld terwijl u scrolt in Excel?
Als er een grafiek in een werkblad is ingevoegd, verdwijnt deze uit beeld zodra u naar beneden scrolt om de gegevens te bekijken – zoals te zien is in de schermafbeelding hieronder. Dat is behoorlijk vervelend! In dit artikel introduceer ik een VBA-code waarmee de grafiek altijd zichtbaar blijft, zelfs terwijl u door het werkblad naar boven of beneden scrolt.
 |
 |
Houd altijd een grafiek in beeld
 Houd altijd een grafiek in beeld
Om een grafiek tijdens het scrollen door het werkblad altijd in beeld te houden, past u de onderstaande VBA-code toe.
1. Klik met de rechtermuisknop op het werkbladtabblad waarvan u de grafiek zichtbaar wilt houden en kies Code weergeven in het contextmenu. Zie de schermafbeelding: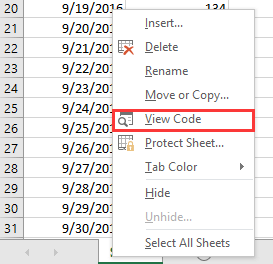
2. Plak in het venster van Microsoft Visual Basic for Applications dat verschijnt de onderstaande code in het lege script.
VBA: Houd grafiek altijd in beeld
Private Sub Worksheet_SelectionChange(ByVal Target As Range)
'UpdatebyExtendoffice20161111
    Dim CPos As Double
    Application.ScreenUpdating = False
    CPos = ActiveWindow.ScrollRow * ActiveCell.RowHeight
    ActiveSheet.ChartObjects("Chart 2").Activate
    ActiveSheet.Shapes("Chart 2").Top = CPos
    ActiveWindow.Visible = False
    Application.ScreenUpdating = True
End Sub
3. Sla op en sluit het dialoogvenster; daarna wordt de grafiek automatisch naar boven of beneden verplaatst zodra u op een willekeurige cel klikt.
Opmerkingen:
(1) In de VBA-code is ‘Grafiek 2’ de naam van de grafiek die u zichtbaar wilt houden; u kunt deze naar wens aanpassen.
(2) Met deze VBA-code kunt u niet meerdere grafieken tegelijk in beeld houden.

Ontgrendel de magie van Excel met KUTOOLS AI
- Slimme uitvoering: Voer celbewerkingen uit, analyseer gegevens en maak grafieken — allemaal met eenvoudige opdrachten.
- aangepaste formules: Genereer op maat gemaakte formules om uw workflows te stroomlijnen.
- VBA-programmeren: Schrijf en implementeer VBA-code moeiteloos.
- Formule-uitleg: Begrijp complexe formules moeiteloos.
- Tekstvertaling: Doorbreek taalbarrières in uw spreadsheets.
Beste Office-productiviteitshulpmiddelen
Geef uw Excel-vaardigheden een boost met Kutools voor Excel en ervaar efficiëntie zoals nooit tevoren.Kutools voor Excel biedt meer dan 300 geavanceerde functies om de productiviteit te verhogen en Tijd besparen.Klik hier om de functie te krijgen die u het meest nodig heeft...
Office Tab brengt een tabbladinterface naar Office en maakt uw werk veel eenvoudiger
- Schakel tabbladbewerking en -lezen in voor Word, Excel, PowerPoint, Publisher, Access, Visio en Project.
- Open en maak meerdere documenten aan in nieuwe tabbladen binnen hetzelfde venster, in plaats van in afzonderlijke vensters.
- Verhoogt uw productiviteit met 50 % en bespaart u dagelijks honderden muisklikken!
Alle Kutools-add-ins in één installatieprogramma.
Kutools for Office bundelt add-ins voor Excel, Word, Outlook en PowerPoint, plus Office Tab Pro—ideaal voor teams die met meerdere Office-apps werken.
- Alles-in-één suite— add-ins voor Excel, Word, Outlook & PowerPoint plus Office Tab Pro
- Één installatieprogramma, één licentie— binnen enkele minuten klaar (MSI-geschikt)
- Werkt beter samen— gestroomlijnde productiviteit in alle Office-apps
- 30 dagen volledig functionele proefversie— geen registratie, geen creditcard
- Beste prijs-kwaliteitverhouding— bespaar ten opzichte van het afzonderlijk kopen van add-ins