Hoe gegevens uit een grafiek of diagram in Excel extraheren?
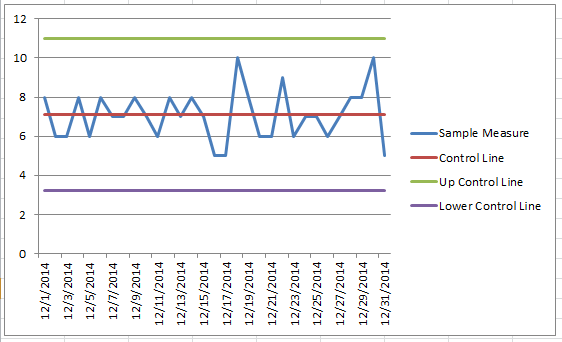
Grafieken in Excel worden veel gebruikt om gegevens en trends effectiever te visualiseren. Er kunnen echter situaties zijn waarin u alleen een grafiek heeft zonder toegang tot de originele gegevens, zoals in het onderstaande voorbeeld wordt getoond. In dergelijke gevallen kan het extraheren van de gegevens uit de grafiek essentieel zijn. Deze handleiding biedt een stap-voor-stap uitleg over het ophalen van gegevens uit een grafiek of diagram in Excel met behulp van VBA-code.
Gegevens uit grafiek extraheren met VBA
1. U moet een nieuw werkblad maken en dit hernoemen naar "ChartData". Zie screenshot:

2. Selecteer de grafiek waaruit u gegevens wilt extraheren. Druk tegelijkertijd op de toetsen "Alt" + "F11" om het venster "Microsoft Visual Basic for Applications" te openen.
3. Klik op "Invoegen" > "Module", en plak vervolgens de onderstaande VBA-code in het "Module"-venster.
Sub GetChartValues()
    'Updateby20220510
    Dim xNum As Integer
    Dim xSeries As Object
    On Error Resume Next
    xCount = 2
    xNum = UBound(Application.ActiveChart.SeriesCollection(1).Values)
    Application.Worksheets("ChartData").Cells(1, 1) = "X Values"
    With Application.Worksheets("ChartData")
        .Range(.Cells(2, 1), _
        .Cells(xNum + 1, 1)) = _
        Application.Transpose(ActiveChart.SeriesCollection(1).XValues)
    End With
    For Each xSeries In Application.ActiveChart.SeriesCollection
        Application.Worksheets("ChartData").Cells(1, xCount) = xSeries.Name
        With Application.Worksheets("ChartData")
            .Range(.Cells(2, xCount), _
            .Cells(xNum + 1, xCount)) = _
            Application.WorksheetFunction.Transpose(xSeries.Values)
        End With
        xCount = xCount + 1
    Next
End Sub
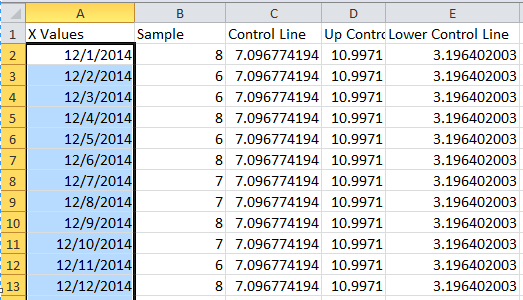
4. Klik vervolgens op de knop "Uitvoeren" om de VBA-code uit te voeren. Zie screenshot:

U ziet dan dat de gegevens naar het werkblad "ChartData" zijn geëxtraheerd.
Tip:
1. U kunt de cellen indelen zoals u nodig hebt.
2. Standaard worden de gegevens van de geselecteerde grafiek geëxtraheerd vanaf de eerste cel van het werkblad ChartData.
Tip: Als u vaak werkt met complexe grafieken in Excel, kan het elke keer opnieuw maken ervan tijdrovend zijn. Met het hulpmiddel "AutoTekst" van "Kutools voor Excel" kunt u dit proces vereenvoudigen. Maak de grafieken één keer, voeg ze toe aan het AutoTekst-paneel en hergebruik ze op elk moment en op elke locatie. U hoeft alleen de verwijzingen bij te werken om aan uw specifieke behoeften te voldoen.
Kutools voor Excel - Boost Excel met meer dan 300 essentiële tools. Geniet van permanent gratis AI-functies! Nu verkrijgen |

Beste productiviteitstools voor Office
Verbeter je Excel-vaardigheden met Kutools voor Excel en ervaar ongeëvenaarde efficiëntie. Kutools voor Excel biedt meer dan300 geavanceerde functies om je productiviteit te verhogen en tijd te besparen. Klik hier om de functie te kiezen die je het meest nodig hebt...
Office Tab brengt een tabbladinterface naar Office en maakt je werk veel eenvoudiger
- Activeer tabbladbewerking en -lezen in Word, Excel, PowerPoint, Publisher, Access, Visio en Project.
- Open en maak meerdere documenten in nieuwe tabbladen van hetzelfde venster, in plaats van in nieuwe vensters.
- Verhoog je productiviteit met50% en bespaar dagelijks honderden muisklikken!
Alle Kutools-invoegtoepassingen. Eén installatieprogramma
Kutools for Office-suite bundelt invoegtoepassingen voor Excel, Word, Outlook & PowerPoint plus Office Tab Pro, ideaal voor teams die werken met Office-toepassingen.
- Alles-in-één suite — invoegtoepassingen voor Excel, Word, Outlook & PowerPoint + Office Tab Pro
- Eén installatieprogramma, één licentie — in enkele minuten geïnstalleerd (MSI-ready)
- Werkt beter samen — gestroomlijnde productiviteit over meerdere Office-toepassingen
- 30 dagen volledige proef — geen registratie, geen creditcard nodig
- Beste prijs — bespaar ten opzichte van losse aanschaf van invoegtoepassingen